
operations
Kubernetes requests vs usage: finding reserved but idle CPU and memory
Compare what pods reserve with what they use over a week, in PromQL: the rate() trap, p95 vs peak, safe requests, and which pods get evicted first.
A cluster can be full and idle at the same time. The scheduler has no free room
left for your next pod, and kubectl top shows the nodes loafing at a tenth of
their CPU. Both are true, because they measure different things: the scheduler
counts requests, the graphs show usage, and nothing in Kubernetes
compares the two for you.
This post does that comparison with PromQL. You get the room a namespace reserves against what it used over a week, a request you can put in a manifest, and the one case where the gap goes the other way and a pod ends up first in line for eviction. It also covers the query that looks right and is wrong, which we shipped ourselves before a blog post caught it.
What each number means
A request is a reservation. The scheduler subtracts it from a node’s allocatable room whether or not the pod ever uses it. We covered how the CPU half of that turns into cgroup weights in CPU requests vs limits. So every node’s room splits three ways, not two:
- In use: reserved and used.
- Reserved, idle: reserved and not used. The scheduler treats this as full. Trimming requests gives it back.
- Unreserved: never asked for. The scheduler can already place pods here.
A single “utilisation” percentage blurs the middle band with the last one, and those two call for opposite fixes. Idle reservation means lowering requests. Unreserved room means you have more nodes than your requests need. That is why a drain can strand pods on a cluster that looks idle.
Step 1: what each namespace reserves
kube-state-metrics exports every container’s requests. Filter to running pods; otherwise completed Jobs keep contributing requests they no longer hold:
sum by (namespace) (
  kube_pod_container_resource_requests{resource="cpu"}
  * on (namespace, pod) group_left ()
  (kube_pod_status_phase{phase="Running"} == 1)
)
kube-system   1.05
monitoring    0.12
That output is from a test cluster running the stock kube-prometheus-stack, and it shows the first surprise: most of that chart sets no requests at all. A pod with no request uses room the scheduler thinks is empty. It does not show up as waste here, and it shows up as risk further down.
Step 2: usage over a week, and the query that lies
The obvious query for “average CPU per pod over seven days” is a rate over seven days:
# Wrong whenever there is less than 7 days of data
sum by (namespace, pod) (
  rate(container_cpu_usage_seconds_total{container!="", container!="POD"}[7d])
)
It returns plausible numbers, and they can be off by any factor. Prometheus
divides a rate by the whole range you asked for, not by the part that
holds samples. Take a pod that started yesterday: its seven-day “average” is its
real average divided by seven. On a backend with two days of retention, every
pod reads 3.5 times low. Our test cluster had 1.7 hours of data, which put this
query about a hundred times low:
                              rate(...[7d])   mean of 5m rates
kube-apiserver                0.00041         0.0398
etcd                          0.00017         0.0162
prometheus                    0.00012         0.0116
We had this exact query in the app’s Efficiency screen. On a production cluster with two days of retention, it reported 2% of reserved CPU in use; the true figure was 8%. The low number looked believable, which is why it survived. It turned up while we were writing this post, when a seven-day average came out a hundred times smaller than its own p95.
VictoriaMetrics and Thanos behave the same way; we checked both. This is not a quirk of one backend.
The fix is to average short rates over the steps where the pod actually has data:
avg_over_time(
  sum by (namespace, pod) (
    rate(container_cpu_usage_seconds_total{container!="", container!="POD"}[5m])
  )[7d:5m]
)
It is a subquery: every 5 minutes for 7 days, take a 5-minute rate, then average
the rates that exist. A pod that has lived for one day is averaged over that day.
Memory needs none of this, because avg_over_time on a gauge already averages
only the samples it has.
Then ask how much history there actually is, because “7 days” in the query is a request, not a promise:
time() - min_over_time(
  timestamp(count(container_memory_working_set_bytes{container!="", container!="POD"}))[7d:5m]
)
6181.29
That is seconds: 1.7 hours of a requested week. Put that next to any average you report. A number without its coverage invites the wrong conclusion.
With both halves, namespace efficiency is a division:
sum by (namespace) (
  avg_over_time(sum by (namespace, pod) (
    rate(container_cpu_usage_seconds_total{container!="", container!="POD"}[5m])
  )[7d:5m])
)
/
sum by (namespace) (
  kube_pod_container_resource_requests{resource="cpu"}
  * on (namespace, pod) group_left () (kube_pod_status_phase{phase="Running"} == 1)
)
monitoring    0.249
kube-system   0.074
Step 3: a request you can write down
An average tells you there is slack. It does not tell you the request to set, because a workload that averages 0.1 cores and spends lunchtime at 0.8 needs the 0.8. The two resources fail differently, so they get different high-water marks:
CPU: the 95th percentile of 5-minute rates. CPU above the request is not fatal. The pod competes for spare cycles and, at worst, slows down. Covering the p95 lets the rare spike borrow instead of reserving for it all week.
quantile_over_time(0.95,
  sum by (namespace, pod) (
    rate(container_cpu_usage_seconds_total{container!="", container!="POD"}[5m])
  )[7d:5m]
)
Memory: the peak. Memory is not compressible. Crossing the limit is an OOMKill, and crossing the request under pressure is a place near the front of the eviction queue (next section).
sum by (namespace, pod) (
  max_over_time(container_memory_working_set_bytes{container!="", container!="POD"}[7d])
)
Requests are per pod, and replicas are not equal. A leader, a shard with the hot
keys or the pod that happens to take the cron traffic will run hotter than the
rest. So size from the busiest pod’s figure, not the workload’s mean. Add
headroom (we use 15%) and round to something a person would type: 170m, not
0.16837.
Two rules keep this from being confidently wrong:
- No suggestion without a full day of data, counted from the youngest pod. A rollout restarts every pod’s clock. Two hours of history after a deploy misses the nightly batch, and a request sized from it will be too small.
- Sample at the same step you average over. The p95 and the average above
share one
[7d:5m]subquery, so the p95 can never sit below the average because of different sampling. If it does, the distribution really is spike-shaped: mostly idle, with a few bursts.
Step 4: memory above its request, the part that is not about saving
The gap can also run the other way. A pod whose memory sits above its request is not saving you anything. It is using room nobody reserved for it, and when that room runs out, it is the first to go. The kubelet’s eviction order, from the node-pressure eviction docs:
- Whether the pod’s resource usage exceeds requests
- Pod Priority
- The pod’s resource usage relative to requests
And, less well known: “The kubelet does not use the pod’s QoS class to determine the eviction order.” A Burstable pod that stayed within its request outlives one that exceeded it, whatever the QoS class.
sum by (namespace, pod) (container_memory_working_set_bytes{container!="", container!="POD"})
> on (namespace, pod)
sum by (namespace, pod) (kube_pod_container_resource_requests{resource="memory"})
monitoring prometheus-kps-kube-prometheus-stack-prometheus-0 355606528
Prometheus itself, at 339 MiB against a 256 MiB request, is the pod this node evicts first. Meanwhile its sidecars request nothing. This comparison can’t see pods that request no memory at all. The query finds no series to match them against, so check those separately: to the scheduler they weigh nothing, yet they hold real memory.
On the production cluster, this list was more useful than the savings list. One rendering StatefulSet requested 1 GiB per pod and peaked near 4. It is exactly the pod you want to keep, and it would have been the first one evicted.
What it looked like on a real cluster
The production cluster from earlier, over the two days its Prometheus retains:
| Reserved | Used (average) | In use | Reserved, idle | |
|---|---|---|---|---|
| CPU | 5.09 cores | 0.39 cores | 8% | 4.70 cores |
| Memory | 18.4 GiB | 10.3 GiB | 56% | 8.2 GiB |
The pattern is typical. CPU requests are guesses, made once, and they are high, because a pod that gets too little CPU slows down and someone notices. Memory runs closer to the line, because a request that is too low shows up as an eviction. So the savings are in CPU, while the risk sits in a few memory-heavy workloads. Split that way, the work is two short lists instead of a cluster-wide right-sizing project.
Doing it without writing the PromQL
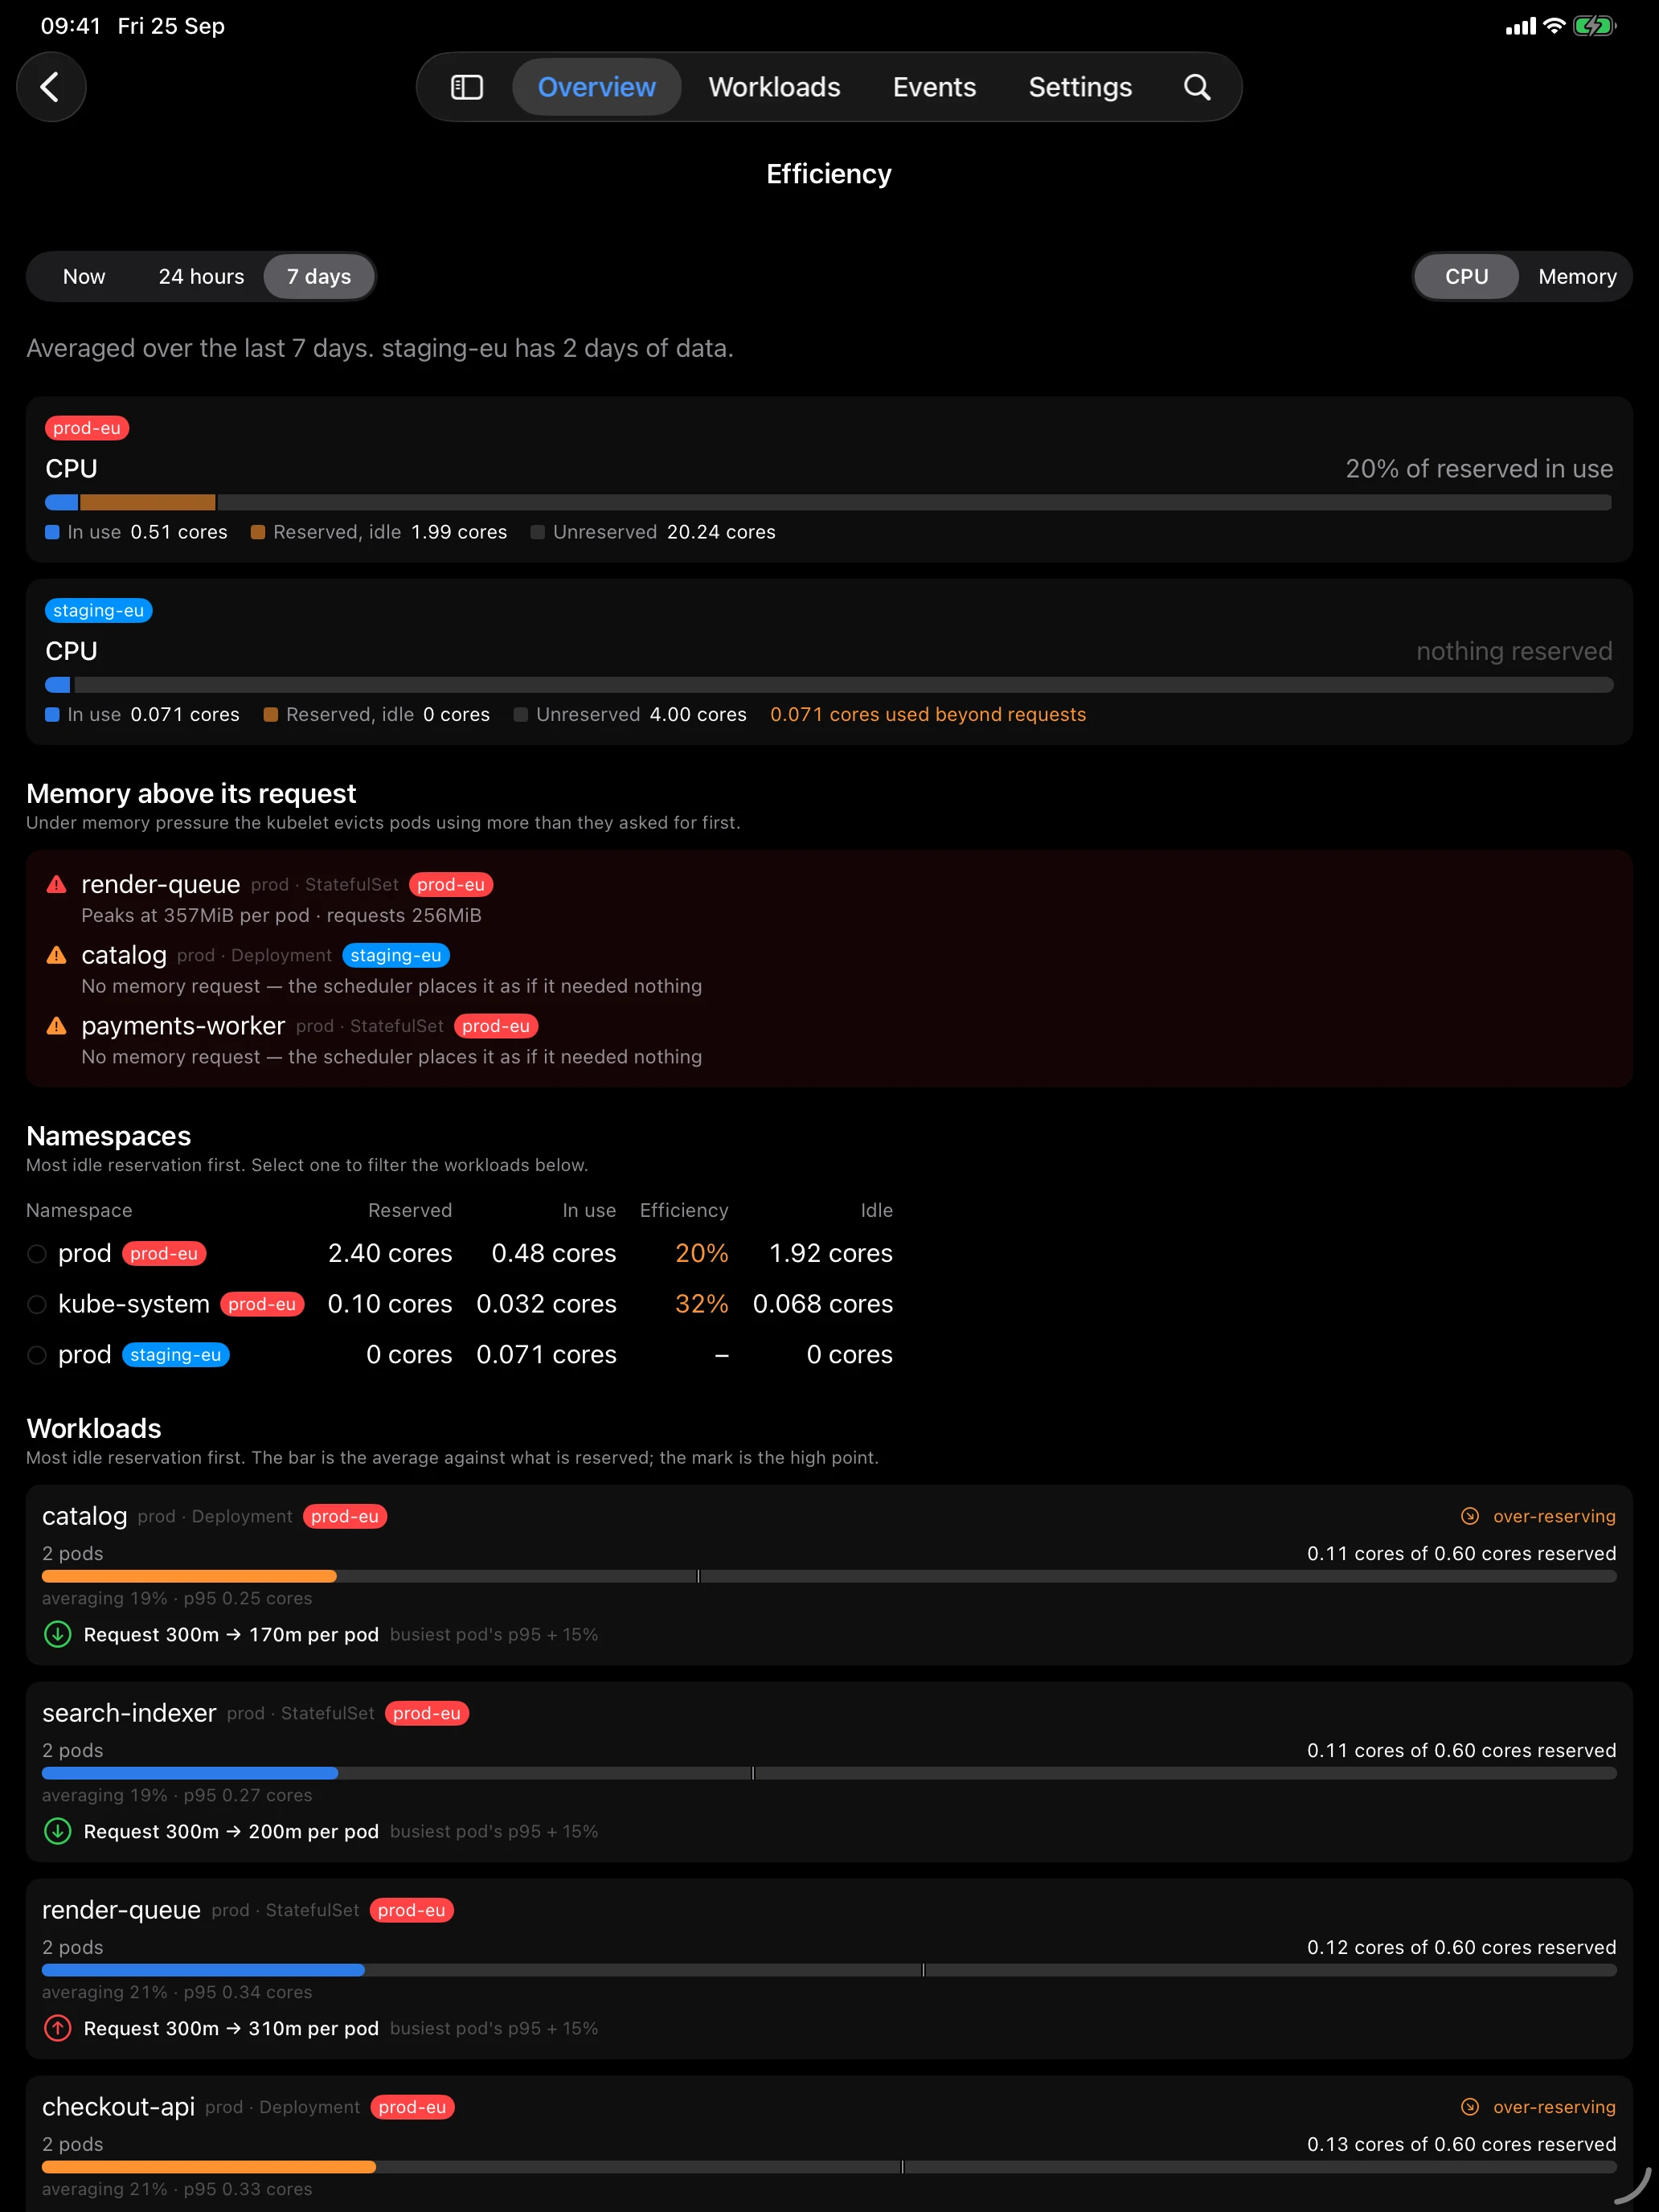
KubeGlance 1.2 has an Efficiency screen that runs these queries for you. It finds the cluster’s Prometheus, VictoriaMetrics or Thanos on its own, through the API server’s service proxy (how that works is in querying Prometheus through the Kubernetes API), and it states how much history the backend holds instead of pretending it has a week:
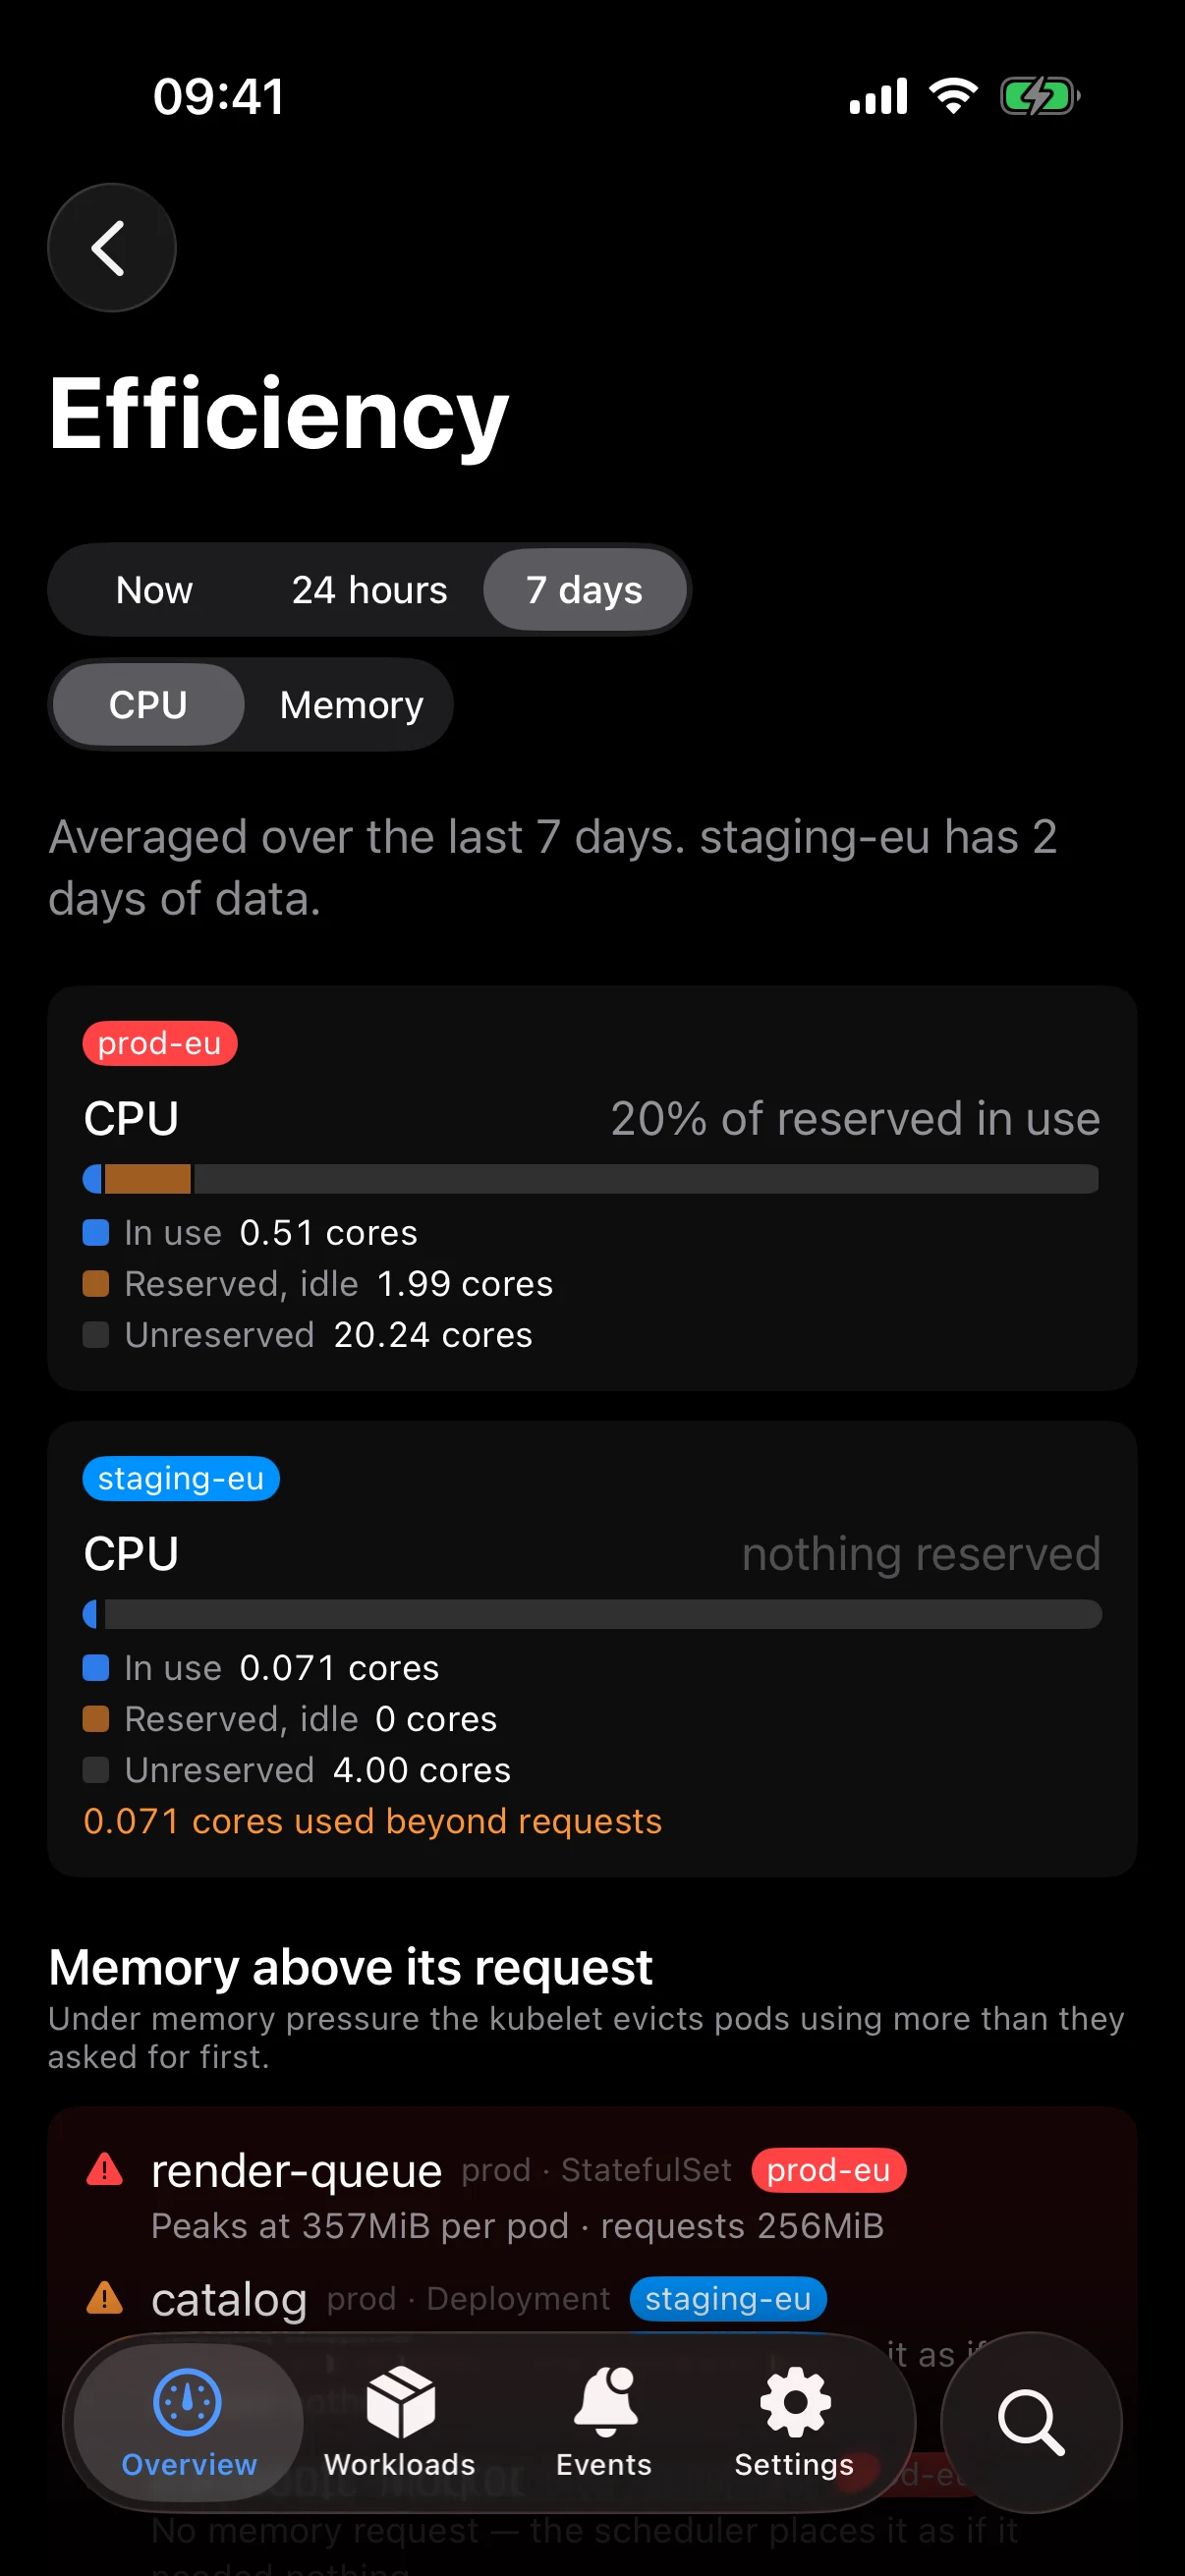
On a larger screen, namespaces are ranked by idle reservation. Workloads get a suggested per-pod request only where a full day of history backs it. A bursty workload is told to raise its request rather than being flagged as wasteful:
The short version
- Requests come from kube-state-metrics, restricted to running pods. Usage comes from cAdvisor.
- Never
rate(x[7d])for an average. Average 5-minute rates withavg_over_time(...[7d:5m]), and report the coverage next to it. - CPU requests from the busiest pod’s p95, memory from its peak, plus headroom, and only after a full day of data.
- Check memory above request before you cut anything. Those pods are evicted first, QoS class notwithstanding.
See reserved against used for every cluster, with suggested requests and eviction risks, found without configuration. KubeGlance is a native Kubernetes client for iPhone and iPad, with a full Mac app on the same core.
Get KubeGlanceThe Kubernetes dashboard that fits in your pocket
KubeGlance is a native Kubernetes client for iPhone and iPad — the real dashboard, not a companion — with a full Mac app on the same core. Pods, workloads, logs and events, straight from your kubeconfig.
Download KubeGlance