
kubectl
Query Prometheus through the Kubernetes API server, without port-forward
Reach Prometheus, VictoriaMetrics or Thanos with kubectl get --raw through the API server's service proxy: the URL, the RBAC, and two misleading 503s.
Your kubeconfig can already reach Prometheus. The API server will forward a
request to any Service in the cluster, using the credentials and RBAC you
already have — no kubectl port-forward running in another terminal, no
Ingress, nothing exposed:
kubectl get --raw \
  "/api/v1/namespaces/monitoring/services/prometheus:9090/proxy/api/v1/query?query=vector(1)"
{"status":"success","data":{"resultType":"vector","result":[{"metric":{},"value":[1790310064.709,"1"]}]}}
That is the whole trick. The rest of this article is the three things that go wrong with it: finding the right Service, getting the port part of the URL right, and writing RBAC that actually matches. Every command below was run against Kubernetes 1.31 (a managed cluster) and 1.36 (kind) with the upstream Helm charts for Prometheus, VictoriaMetrics and Thanos installed.
The URL, piece by piece
/api/v1/namespaces/<namespace>/services/[https:]<service>:<port>/proxy/<path>
<service>:<port>— the Service name, and either the port number or the port’s name. This part matters more than it looks; see below.https:— only when the backend itself serves TLS. The prefix is part of the documented URL format.<path>— everything after/proxyis sent to the backend unchanged. For Prometheus that is its normal HTTP API:/api/v1/query,/api/v1/query_range,/api/v1/series.
Because kubectl get --raw sends the path as-is, anything that is not a plain
character has to be percent-encoded by you. vector(1) survives; a label
matcher does not:
kubectl get --raw "/api/v1/namespaces/monitoring/services/thanos-query:9090/proxy/api/v1/query_range?query=sum(rate(container_cpu_usage_seconds_total%7Bnamespace%3D%22kube-system%22%7D%5B2m%5D))&start=1790312207&end=1790312507&step=60"
{"status": "success", "data": {"resultType": "matrix", "result": [{"metric": {}, "values": [[1790312207, "0.14614252031913721"], [1790312267, "0.15441601343087266"], [1790312327, "0.15829735196927217"], ...
Here is what happens to that request:
Finding the Service that actually answers queries
“Grep for prometheus” is the obvious first move, and on a cluster running the
common stacks it is nearly useless. This is a test cluster with
kube-prometheus-stack, the prometheus-community prometheus chart,
VictoriaMetrics single-node and cluster, and a Thanos Query:
kubectl get svc -A -o custom-columns='NAMESPACE:.metadata.namespace,NAME:.metadata.name,PORTS:.spec.ports[*].port' \
  | grep -Ei 'NAMESPACE|prometheus|victoria|vmselect|thanos'
NAMESPACE        NAME                                                PORTS
kube-system      kps-kube-prometheus-stack-coredns                   9153
kube-system      kps-kube-prometheus-stack-kube-controller-manager   10257
kube-system      kps-kube-prometheus-stack-kube-etcd                 2381
kube-system      kps-kube-prometheus-stack-kube-proxy                10249
kube-system      kps-kube-prometheus-stack-kube-scheduler            10259
kube-system      kps-kube-prometheus-stack-kubelet                   10250,4194,10255
monitoring       kps-kube-prometheus-stack-alertmanager              9093,8080
monitoring       kps-kube-prometheus-stack-operator                  443
monitoring       kps-kube-prometheus-stack-prometheus                9090,8080
monitoring       kps-kube-prometheus-stack-thanos-discovery          10901,10902
monitoring       kps-prometheus-node-exporter                        9100
monitoring       prometheus-operated                                 9090,10901
monitoring       thanos-query                                        9090,10901
prom-community   pc-prometheus-pushgateway                           9091
prom-community   pc-prometheus-server                                80
vm-cluster       vmc-victoria-metrics-cluster-vminsert               8480
vm-cluster       vmc-victoria-metrics-cluster-vmselect               8481
vm-cluster       vmc-victoria-metrics-cluster-vmstorage              8482,8401,8400
vm               vms-victoria-metrics-single-server                  8428
Nineteen matches. Six of them answer queries:
| Service | Port | Path prefix | What it is |
|---|---|---|---|
thanos-query | 9090 | — | Thanos Query: a global view over the Prometheus instances behind it |
…-vmselect | 8481 | /select/0/prometheus | VictoriaMetrics cluster, read side |
vms-victoria-metrics-single-server | 8428 | — | VictoriaMetrics single-node |
kps-kube-prometheus-stack-prometheus | 9090 | — | kube-prometheus-stack’s Prometheus |
pc-prometheus-server | 80 | — | the prometheus-community chart — note the port |
prometheus-operated | 9090 | — | the operator’s headless Service for the same Prometheus pods; works, but the one above is meant for clients |
The other thirteen are why a name search misleads:
- The six in
kube-systemare scrape targets kube-prometheus-stack creates for the control plane. They are named after the Helm release, so they all contain “prometheus”. None of them is Prometheus. - Alertmanager (9093), the Pushgateway (9091), node-exporter (9100) and the operator (443) are part of the stack but serve no queries.
vminsertaccepts writes only andvmstoragetalks to the other VictoriaMetrics components, not to you. Queries go tovmselect.thanos-discoveryexposes the sidecar’s gRPC store API for Thanos Query.
The fastest way to settle it is to ask. Anything that returns
"status":"success" for vector(1) speaks the Prometheus API:
kubectl get --raw "/api/v1/namespaces/prom-community/services/pc-prometheus-server:80/proxy/api/v1/query?query=vector(1)"
Answering is not the same as being useful, though. A Prometheus that only scrapes one application answers every query and holds no Kubernetes data. Ask for a container metric to tell them apart:
kubectl get --raw "/api/v1/namespaces/vm/services/vms-victoria-metrics-single-server:8428/proxy/api/v1/query?query=count(container_cpu_usage_seconds_total)"
VictoriaMetrics cluster puts a tenant in the path
Single-node VictoriaMetrics serves the Prometheus API at its root, exactly like
Prometheus. In cluster mode the read side, vmselect, serves it under a tenant
path — 0 is the default tenant:
kubectl get --raw "/api/v1/namespaces/vm-cluster/services/vmc-victoria-metrics-cluster-vmselect:8481/proxy/select/0/prometheus/api/v1/query?query=count(up)"
{"status":"success","isPartial":false,"data":{"resultType":"vector","result":[{"metric":{},"value":[1790310937,"6"]}]},"stats":{"seriesFetched": "6", ...
Without /select/0/prometheus, vmselect answers 400 Bad Request — which
kubectl reports as “the server rejected our request for an unknown reason”.
Note the extra isPartial and stats fields too: anything parsing the
response strictly will need to ignore them.
“no endpoints available for service” — with healthy pods
This is the most misleading error on this path. The pods are running, the Endpoints are populated, and the API server says there is nothing to talk to:
kubectl get --raw "/api/v1/namespaces/monitoring/services/kps-kube-prometheus-stack-prometheus/proxy/api/v1/query?query=vector(1)"
Error from server (ServiceUnavailable): no endpoints available for service "kps-kube-prometheus-stack-prometheus"
The port was left out. Without one, the proxy looks for an unnamed port, and every Service in this cluster names its ports:
kubectl get svc -n monitoring kps-kube-prometheus-stack-prometheus \
  -o jsonpath='{range .spec.ports[*]}{.name}={.port} {end}'
http-web=9090 reloader-web=8080
It is not about the Service having several ports. Single-port VictoriaMetrics
fails the same way, because its one port is named http. Give the port, by
number or by name, and both work:
kubectl get --raw ".../services/kps-kube-prometheus-stack-prometheus:9090/proxy/api/v1/query?query=vector(1)"
kubectl get --raw ".../services/kps-kube-prometheus-stack-prometheus:http-web/proxy/api/v1/query?query=vector(1)"
Scaling a backend to zero produces the identical message, so the error alone cannot tell you which problem you have. Check the port part of the URL before you go looking for broken pods.
A different 503 exists too: error trying to reach service: EOF. We saw it
intermittently against a healthy Prometheus on the managed cluster — a few times
across dozens of requests, never reproducibly, and the identical request
succeeded straight after. It is safe to retry a read once when you see exactly
that message. Do not retry “no endpoints available”; that one does not fix
itself.
RBAC: the name includes the port
To use the proxy you need get on the services/proxy subresource. A
namespace-scoped Role is enough, and it can be narrowed to one Service with
resourceNames. This is the obvious way to write that, and it is denied:
rules:
  - apiGroups: [""]
    resources: ["services/proxy"]
    resourceNames: ["kps-kube-prometheus-stack-prometheus"]
    verbs: ["get"]
Error from server (Forbidden): services "kps-kube-prometheus-stack-prometheus:9090" is forbidden: User "system:serviceaccount:monitoring:proxy-reader" cannot get resource "services/proxy" in API group "" in the namespace "monitoring"
The error spells out why. The resource name being authorized is
kps-kube-prometheus-stack-prometheus:9090 — the port is part of it, and
RBAC compares strings. So the Role has to name the port too:
resourceNames: ["kps-kube-prometheus-stack-prometheus:9090"]
And it has to be the same spelling the client uses. With that Role,
…:9090/proxy/… is allowed and …:http-web/proxy/… — the same port, by
name — is forbidden. If you do not control which form the client sends, list
both, or drop resourceNames and scope by namespace instead.
Checking this with kubectl auth can-i has its own trap. services/proxy in
the resource position reads as a Service named proxy, so this answers “no”
for a user who can in fact query:
kubectl auth can-i get services/proxy -n monitoring --as=system:serviceaccount:monitoring:proxy-reader
no
The subresource has its own flag, and the name must include the port:
kubectl auth can-i get services/kps-kube-prometheus-stack-prometheus:9090 --subresource=proxy \
  -n monitoring --as=system:serviceaccount:monitoring:proxy-reader
yes
get is the read-only half
The HTTP method maps onto the RBAC verb. A GET through the proxy needs get on
services/proxy; a POST needs create. So a Role with only get cannot send a
POST, even to an endpoint that would accept one:
kubectl create --raw "/api/v1/namespaces/monitoring/services/kps-kube-prometheus-stack-prometheus:9090/proxy/api/v1/query?query=vector(1)" \
  -f body.json --as=system:serviceaccount:monitoring:proxy-reader
Error from server (Forbidden): services "kps-kube-prometheus-stack-prometheus:9090" is forbidden: User "system:serviceaccount:monitoring:proxy-reader" cannot create resource "services/proxy" in API group "" in the namespace "monitoring"
The same request as an admin succeeds, so the denial is RBAC’s, not
Prometheus’s. That matters because Prometheus’s dangerous endpoints are all
writes: series deletion under --web.enable-admin-api, and /-/reload and
/-/quit under --web.enable-lifecycle. Grant get and the proxy is a
read-only window; grant create and it is not. The same reasoning is behind
a read-only RBAC role for a dashboard, and
scoping a kubeconfig down covers the rest.
Why go through the API server at all
A port-forward works too. The proxy wins in three ways:
- Nothing new is exposed. The backend stays a ClusterIP Service. There is no Ingress, no LoadBalancer and no extra credential to rotate.
- Access is the access you already have. The same kubeconfig, the same audit log, the same RBAC — revoke someone’s cluster access and their metrics access goes with it.
- No process to babysit. A port-forward is a long-lived connection to one pod that dies with it. The proxy resolves the endpoint on every request.
The cost is that every query passes through the API server. Fine for a person or a dashboard asking every few seconds; not a path for a heavy recording-rule workload.
Doing this automatically
This is how KubeGlance gets pod history, and from version 1.2 it no
longer asks you where Prometheus is. On each cluster it ranks the Services the way the
table above does — skipping the Alertmanagers, the Pushgateways and the
kube-system scrape helpers — and asks the best few with a single instant
query, preferring one that actually holds container metrics. Two clusters can
use two different backends:
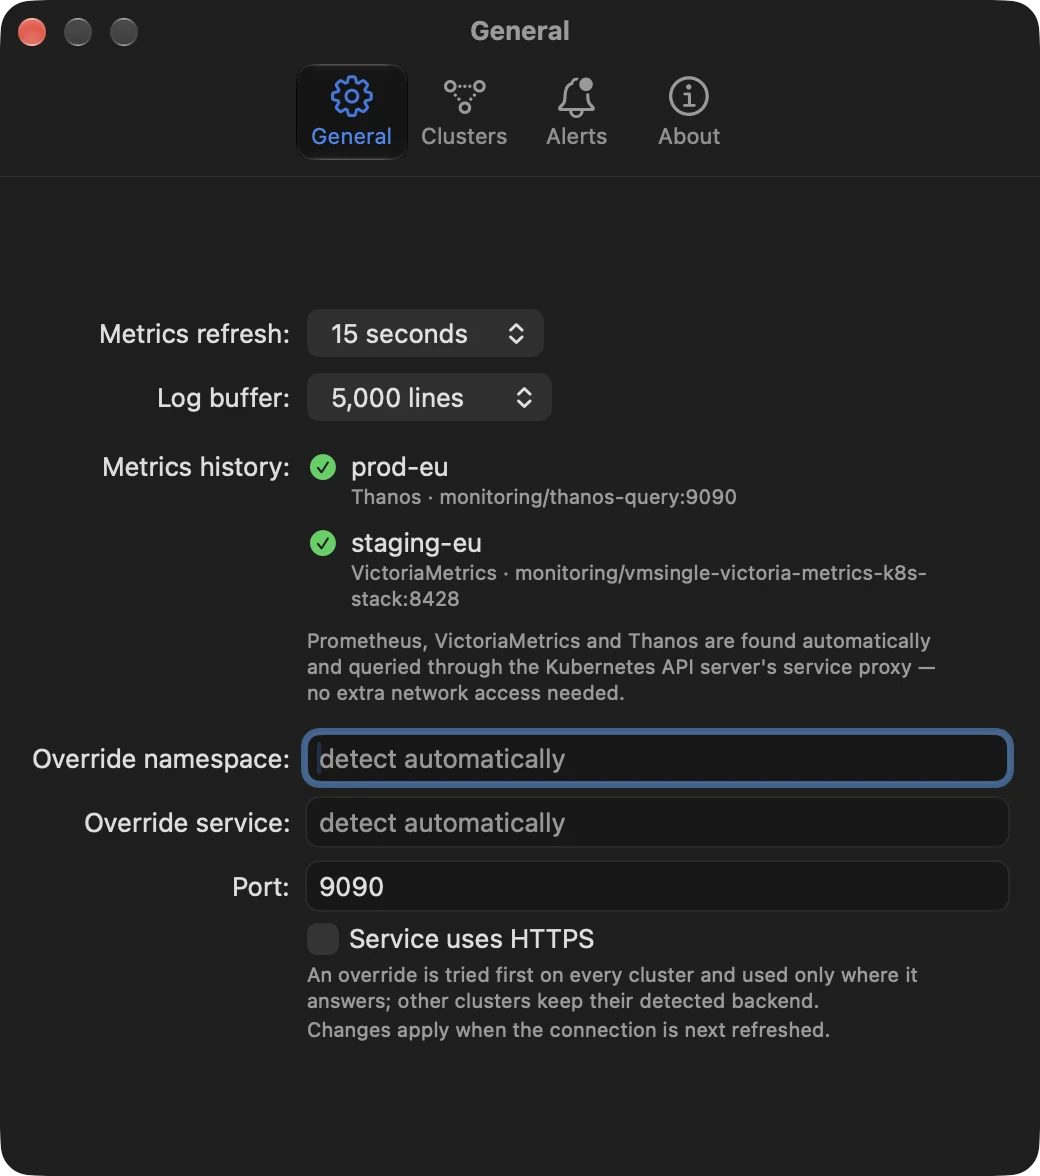
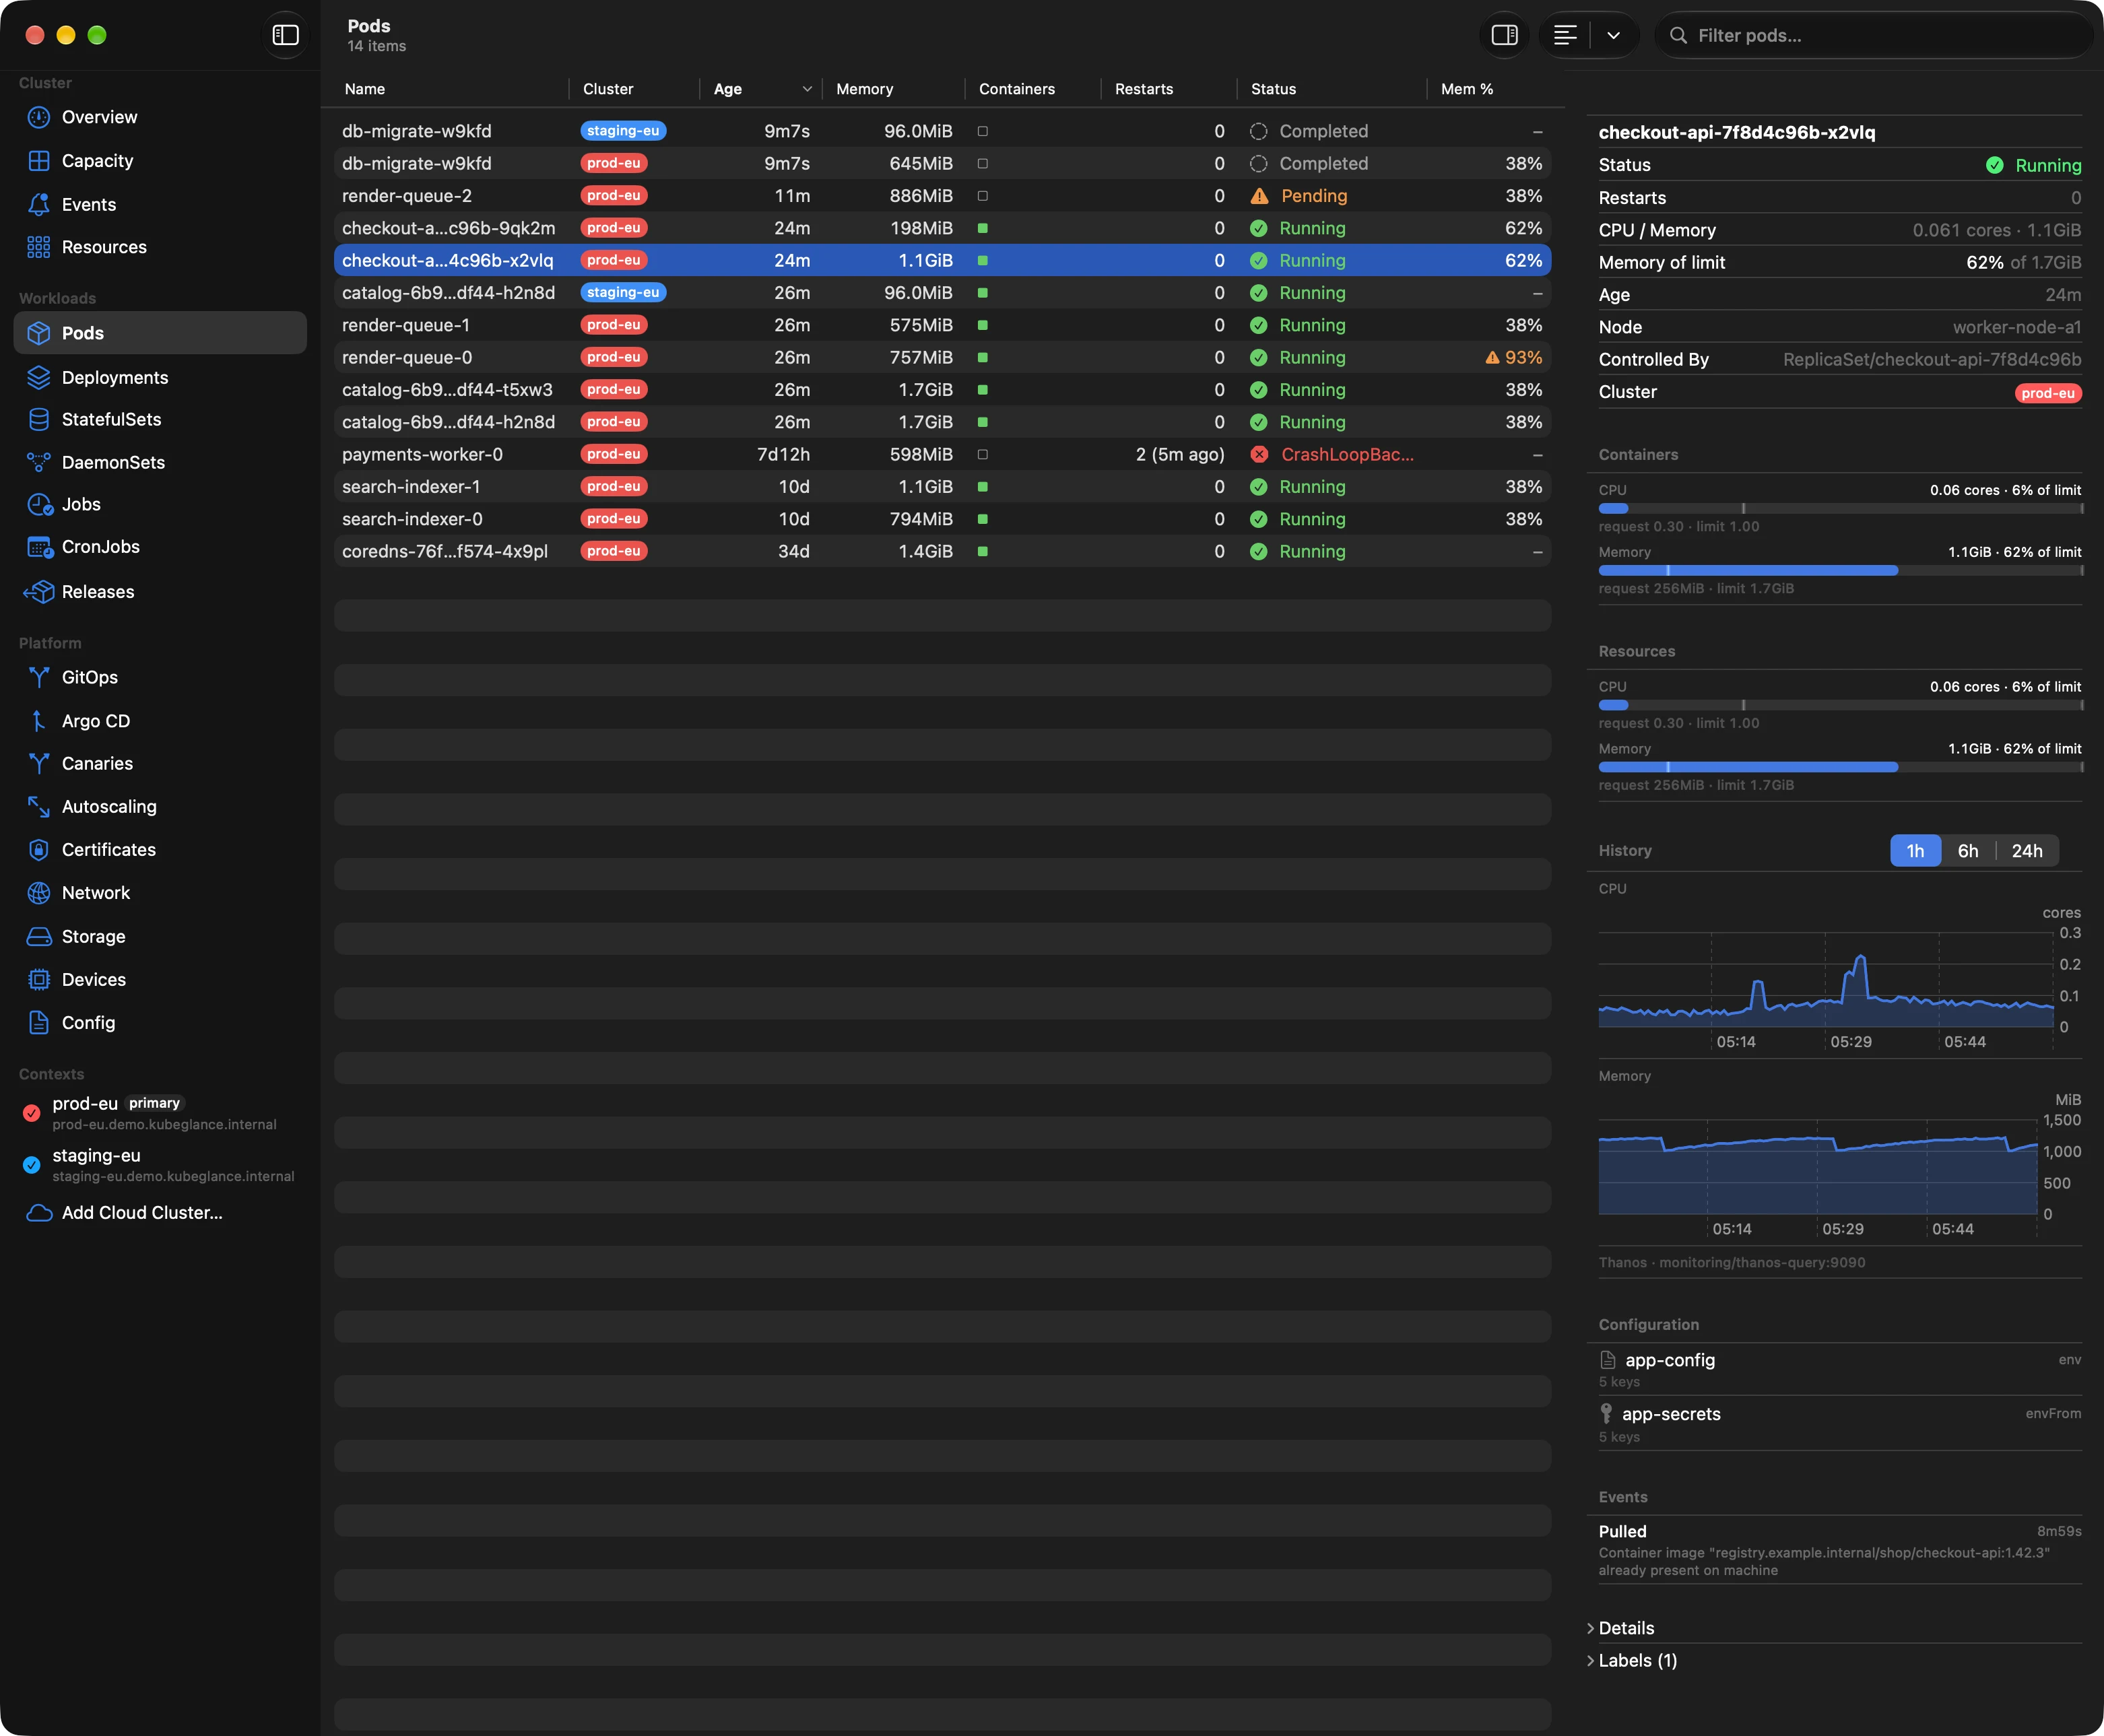
Pod detail then charts CPU and memory from whichever backend the pod’s cluster has, and says which one it was:
For what the live number next to those charts is, and why it disagrees with Grafana, see why kubectl top disagrees with your dashboard.
Pod CPU and memory history from Prometheus, VictoriaMetrics or Thanos, found without configuration. KubeGlance is a native Kubernetes client for iPhone and iPad, with a full Mac app on the same core.
Get KubeGlanceThe Kubernetes dashboard that fits in your pocket
KubeGlance is a native Kubernetes client for iPhone and iPad — the real dashboard, not a companion — with a full Mac app on the same core. Pods, workloads, logs and events, straight from your kubeconfig.
Download KubeGlance